More Beer Please
What Australian resource companies actually pay in tax — and why the beer comparison, while accurate, tells exactly the wrong story

1. The Full Tax Stack
The public debate about resource company taxation in Australia rarely describes what companies actually pay. Commentary focuses on one instrument — usually the Petroleum Resource Rent Tax (PRRT) or state royalties — and presents it as the whole picture. It is not. Australian resource companies face taxes at four distinct levels of government, through at least a dozen separate instruments, plus a growing category of environmental compliance costs that operate like taxes but are rarely classified as such.
What follows is a complete inventory of what resource companies pay, how each instrument works, and why the design matters as much as the rate.
1.1 Federal Taxes
Corporate Income Tax — 30%
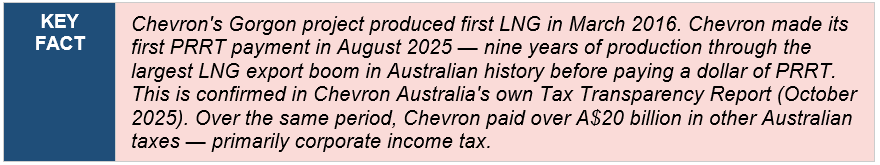
The same company tax rate paid by every Australian business — 30% for companies with aggregated turnover above $50 million, 25% for smaller entities. There is nothing special about the rate resource companies pay. For resource companies, deductible expenses include royalties paid to state governments, exploration and development costs, and accelerated depreciation on capital assets. CIT is a profit tax. During the capital-intensive construction phase of a major project — which for LNG can run five to ten years — enormous depreciation deductions can legally eliminate taxable income entirely. Despite this, some LNG operators have still emerged as among Australia’s largest corporate income taxpayers. Chevron Australia was the country’s fourth-largest company income taxpayer in 2023-24, paying $3.5 billion in corporate income tax alone — even before paying a single dollar of PRRT.
Petroleum Resource Rent Tax (PRRT) — 40% nominal rate on offshore projects
The PRRT applies exclusively to offshore petroleum projects. It does not apply to onshore production. Onshore gas — including Queensland’s CSG-to-LNG projects (APLNG, GLNG, QCLNG) — is subject to state-based petroleum royalties instead. This is a critical distinction: the PRRT is a federal instrument applying to WA offshore LNG; QLD CSG-to-LNG pays QLD state royalty. The same commodity, exported to the same markets, is taxed under completely different federal and state frameworks depending purely on geography and extraction method.
The nominal PRRT rate is 40% of assessable receipts after deductions. Companies deduct all capital and operating expenditure, then carry forward any unrecouped expenditure with an annual uplift rate — an interest-style increase on unused deductions. Exploration expenditure is uplifted at the long-term bond rate plus 15%; development and operating expenditure at the bond rate plus 5%.
This uplift mechanism was designed to compensate companies for the time-value cost of early investment. For large LNG projects with enormous upfront capital, it created a compounding deduction bank that grew faster than revenue could offset it. The 2023 reforms capped deductions at 90% of assessable income per year, expected to increase receipts by $2.4 billion over four years — a modest fix relative to the scale of the problem.
The MRRT — A Case Study in Profit-Tax Failure
The Minerals Resource Rent Tax (MRRT) — levied at 22.5% on ‘super profits’ from iron ore and coal — was introduced 1 July 2012 after being projected to raise $12 billion over its first two years. It raised $340 million net over two years — 3% of what was promised — before being repealed in 2014. The ATO spent $50 million administering it. Fewer than 20 companies paid any net tax; over 125 were required to comply while paying nothing.
Three design flaws were fatal. First, even fully depreciated mines were allowed to set a new notional investment cost at current market value, providing virtually unlimited deductions from day one. Second, state royalties were credited dollar-for-dollar against MRRT liability — states could raise royalties at the federal government’s expense and did. Third, commodity prices fell, eliminating ‘super profits’ entirely.

Crude Oil Excise
Applied to crude oil and condensate production at the wellhead under the Excise Tariff Act 1921, at progressive rates tied to price. Applies primarily to North West Shelf production. Separate from and in addition to PRRT. The Commonwealth budget does not report crude oil excise as a standalone line item — it is combined with LPG, aviation fuel, and other petroleum products in the ‘Other fuel products’ excise category, which totalled $2.21 billion across all those products in 2024-25. The crude oil excise component is a subset of that figure but is not separately published. The total oil and gas sector contribution across all federal and state instruments — CIT, PRRT, state royalties, and all excise — was $21.9 billion in 2024-25, a record high, per Australian Energy Producers’ annual survey.
Withholding Tax on Dividends
When profits are repatriated to foreign shareholders — who hold the majority of Australia’s major resource companies — dividend withholding tax applies. The standard rate is 30%, reduced to 15% under most tax treaties with Japan, Korea, China, and the US. This instrument exists specifically to capture a government share from profits paid to shareholders who, as non-residents, do not pay Australian income tax on their Australian-sourced earnings. Without withholding tax, those profits would leave the Australian tax base entirely.
The rate disparity is worth noting plainly. An Australian resident shareholder pays their full marginal income tax rate on dividends — up to 47% — with a franking credit offset for company tax already paid at the corporate level. A foreign shareholder under a tax treaty pays 15%, with no franking credit entitlement. The foreign investors who own the majority of Australia’s largest resource companies pay a lower effective rate on dividend income than Australian shareholders do. The 15% treaty rate was a deliberate policy choice to attract foreign capital. The consequence is that Australian resource wealth, once distributed as profit, generates a smaller tax contribution when it flows offshore than when it stays in Australian hands.
1.2 State Royalties
State royalties are the structural opposite of the PRRT and MRRT. They are collected on the volume or value of the mineral extracted, regardless of profitability. A company cannot reduce its royalty liability by investing more in the business. CapEx, exploration spending, management fees, related-party financing arrangements — none of these reduce the royalty. The royalty is paid on what comes out of the ground.
This is why royalties reliably deliver government revenue. The appropriate analogy is rent on a public asset: the community owns the resource, the company pays to extract it, and the payment is determined by the value of what is extracted — not by what the extractor chooses to report as profit.
Ad Valorem Royalties — percentage of export value
WA iron ore: 7.5% of export value. WA gold: 2.5% of value. QLD gold/copper: sliding scale 2.5–5% based on prevailing price. Revenue rises when commodity prices rise, falls when they fall. Government and company share commodity price risk symmetrically.
Specific (per-tonne) Royalties
NSW coal: $3.63 per tonne for fully washed coal (post-July 2024). Fixed dollar amount per tonne regardless of price. Completely insensitive to commodity markets — simple, certain, non-manipulable.
Tiered Progressive Royalties — QLD coal
Queensland’s coal royalty operates on a progressive tiered structure: 7% below $100/t, rising through multiple tiers to 40% above $300/t. Designed to capture windfall revenue during price spikes — and it worked, delivering $15.4 billion in a single year during the 2022 boom. The same structure becomes confiscatory when prices normalise. At current met coal prices of approximately US$180/t, QLD royalties are running at approximately 20% of revenue. BMA reported paying $0.67 in royalties for every dollar of profit at current prices. The consequences are visible: Bowen Coking Coal in administration, Vitrinite in receivership (February 2026), BHP cutting 750 jobs and freezing all growth investment.
1.3 State Business Taxes
Payroll Tax
Applied by all states on wages above a threshold — rates from 4.75% (QLD) to 6.85% (NSW). For a large iron ore or LNG operation employing thousands of workers at above-average wages, payroll tax is a material annual cost entirely invisible in royalty comparisons.
Stamp Duty (Transfer Duty)
In Queensland and Western Australia, transfer duty applies to resource authorities — mining leases and exploration permits are classified as ‘land’ for duty purposes. When a mining lease is acquired or transferred, duty applies at rates up to 5.75% on transactions over $3 million. A mining lease valued at $500 million attracts approximately $28 million in transfer duty.
Plant and equipment — haul trucks, excavators, crushers, processing equipment — whether new or second-hand, are not dutiable when sold as standalone assets. The duty exposure for the mining sector sits on resource authority transfers and major mine acquisitions, not on equipment transactions. This is still a significant and recurring cost. Every tenement transfer, farm-in, joint venture restructure, or mine acquisition in QLD and WA triggers duty on the resource authority value — and major Pilbara and Bowen Basin transactions routinely involve resource authority values in the hundreds of millions.
Land Tax
Applied by states on the unimproved value of land held. Mining companies hold large tenement areas — often far larger than the actual area currently being mined. A mining tenement in WA or QLD frequently encompasses tens of thousands of hectares of which only a fraction is actively disturbed at any point in time. Land tax obligations accumulate across the full tenement area, not just the operating footprint. Exemptions exist in some states for mining leases actively in production, but the interaction with environmental offset obligations (discussed below) creates additional complexity.
Workers’ Compensation Levies
State-administered levies on payroll based on industry risk classification. Mining is classified as high-risk. Rates vary by state and activity but add a consistent percentage point to effective labour costs above the payroll tax already applied.
1.4 Environmental Compliance Costs — The Hidden Tax Layer
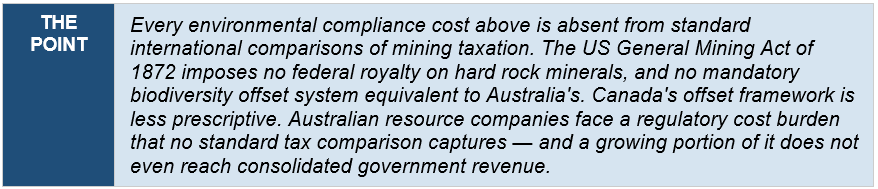
This category is almost entirely absent from public debate about resource taxation. It represents real, quantifiable, government-mandated costs that function as taxes — but are classified as regulatory compliance and therefore excluded from every royalty and tax comparison ever published.
Rehabilitation Bonds and Financial Assurance
Before a mine can operate, companies must lodge financial assurance — typically a cash bond or bank guarantee — equivalent to the estimated cost of fully rehabilitating the site at end of life. For a large open-cut coal mine this runs to hundreds of millions of dollars. The money is held by the Queensland Financial Provisioning Scheme for the life of the mine — decades — and returned only upon certified completion of rehabilitation.
Queensland’s own Financial Provisioning Scheme Annual Report confirmed total estimated rehabilitation cost across all 4,754 Queensland resource environmental authorities and small scale mines at approximately $10.7 billion as at 30 June 2021 — the most recently published aggregate figure — with surety provided of $6.7 billion at that date. ERC requirements have been substantially tightened since. Current aggregate ERC is conservatively estimated at $12-15 billion. The definitive current figure is published in the 2024-25 Financial Provisioning Scheme Annual Report.
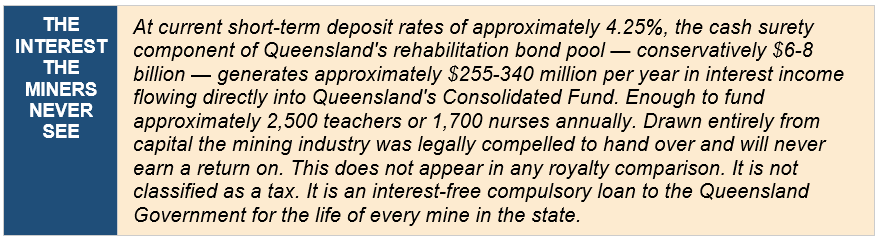
The interest on this capital does not sit idle. Queensland Treasury’s own 2024-25 Annual Report states explicitly: ‘The Fund obtains the interest benefit from the cash surety held’ and ‘Interest earned on the aggregate set-off arrangement balance accrues in the Consolidated Fund.’ The Queensland Government earns interest on the miners’ money and deposits it into general government revenue. The miners receive none of it.
Biodiversity Offset Credits — Compulsory Purchase
As a condition of environmental approval in NSW and Queensland, miners must purchase biodiversity credits equivalent to the ecological impact of their project. The offset obligation is calculated against the actual disturbed area of the project — not the full tenement — but offset ratios greater than 1:1 are common for higher-value habitat, meaning the land purchased to satisfy the obligation is typically larger than the impacted area.
The credit purchase is compulsory. It generates no income-producing asset. It cannot be reduced by operational efficiency. For a major mine, total biodiversity offset credit obligations can reach tens of millions of dollars, determined by a government-approved methodology, not market negotiation.
The Capital Gains Tax Trap on Offsets
When a miner buys biodiversity credits to satisfy an approval condition and immediately retires them, the ATO treats the credits as capital assets rather than operating expenses. The miner crystallises a capital loss — not a capital gain — but that loss can only be offset against capital gains, not against ordinary operating income. A compulsory government-mandated expenditure of potentially tens of millions of dollars may provide no practical tax relief, because the tax system classifies it as a capital transaction rather than an operating cost. Royalties are fully deductible against operating income. The environmental compliance cost may not be.
Where the Offset Money Goes
Unlike royalties and company tax, Safeguard Mechanism compliance costs and biodiversity offset credit purchases do not flow into consolidated government revenue to fund hospitals and schools. ACCU (Australian Carbon Credit Unit) payments go to the sellers of those credits — landholders, carbon project developers, and increasingly, foreign investment funds that have identified Australian carbon credits as an asset class. The biodiversity credit market in NSW alone is valued at over $400 million. This is a tax on Australian industry that does not accrue to the Australian taxpayer. It is a government-mandated transfer from resource producers to a third-party market — without any of the revenue visibility or parliamentary accountability of a conventional tax.
Agricultural Land Permanently Removed From Production
Biodiversity offset sites are protected in perpetuity — binding on every future owner of the title. When offset land was previously agricultural, it is constitutionally removed from food production forever. Not for the life of the mine. Permanently. ABARES projects up to 18 million hectares of agricultural land could shift into carbon sequestration by 2050, with 40% of participating farms fully converting out of production. No government has published a cumulative accounting of agricultural land permanently removed from food production across biodiversity offsets, carbon farming, renewable energy corridors, and transmission infrastructure simultaneously.
Port and Infrastructure Access Levies
Many Australian port and rail infrastructure assets are government-owned. Access charges are set by regulatory determination and function as an effective levy on exports. The Dalrymple Bay Coal Terminal access charges, for example, are determined by regulatory process and add a per-tonne cost to every export that is invisible in royalty comparisons but real in project economics.
2. Three Failure Modes in Australian Resource Taxation
Australia’s resource tax architecture contains three distinct failure modes — each demonstrating a different way in which well-intentioned policy has either failed to collect revenue it promised, destroyed the industry generating that revenue, or created perverse structural incentives.
Failure Mode 1 — The Profit Tax That Collects Nothing
The PRRT and MRRT share the same structural flaw: they tax profit, and sophisticated multinationals can legally manage the timing and quantum of taxable profit through legitimate accounting, capital structuring, and deduction accumulation. The MRRT raised 3% of its projected revenue. The PRRT has collected less than beer excise for most of the LNG export boom. Neither failure reflects illegality — both reflect foreseeable consequences of instrument design that the industry’s own lawyers understood before the legislation was passed.
Failure Mode 2 — The Royalty Set in a Boom, Applied in a Bust
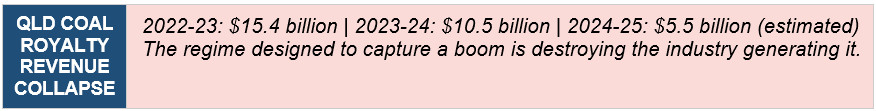
Queensland’s progressive coal royalty tiers were designed and implemented at commodity boom prices. They captured genuine windfall revenue — $15.4 billion in 2022-23. The same tiers applied at 2025 normalised prices produce royalty obligations that exceed operating profit. The result is industry collapse: multiple mines in administration, hundreds of jobs lost, QLD coal royalty revenue falling from $15.4 billion to an estimated $5.5 billion in two years. The government kept the rates. It lost the revenue anyway — and part of the industry with it.
Failure Mode 3 — Federal-State Incentive Misalignment
State royalties were credited dollar-for-dollar against MRRT liability. States raised royalties. The federal government lost equivalent MRRT revenue. The Commonwealth Grants Commission then clawed back GST relativities from states with higher own-source revenue. The QRC’s own CEO acknowledged at the time of the 2022 QLD royalty increases that 80% of the extra revenue raised would be redirected to Canberra via the GST equalisation process. The state got the political credit. The miners paid. The Commonwealth got most of the money. The investment environment was damaged for everyone’s benefit and nobody’s gain.
3. The International Comparison — Total Government Take
3.1 Methodology and Jurisdiction Selection
The standard international comparison uses royalty rates in isolation. This produces a misleading picture because countries have made different choices about how to structure their total government take. A country with a low royalty and high corporate income tax can collect the same total revenue as a country with a high royalty and low corporate tax. The correct metric is Total Government Take (TGT) — every dollar collected at every level of government from every instrument, expressed as a percentage of export value.
This analysis uses a normalised comparison: a consistent reference commodity price applied across all jurisdictions, with jurisdiction-specific cost structures used to calculate profit-based tax liabilities. All figures are converted to Australian dollars at A$1 = US$0.63.
Jurisdictions selected are Australia, the United States, and Canada — the three principal OECD economies with comparable legal and regulatory frameworks, similar environmental obligations, transparent publicly available tax data, and active participation in the same export commodity markets. These are the jurisdictions where the same capital competes for the same investment decisions.
All comparisons are for exported commodities only. Domestically consumed resources are excluded.
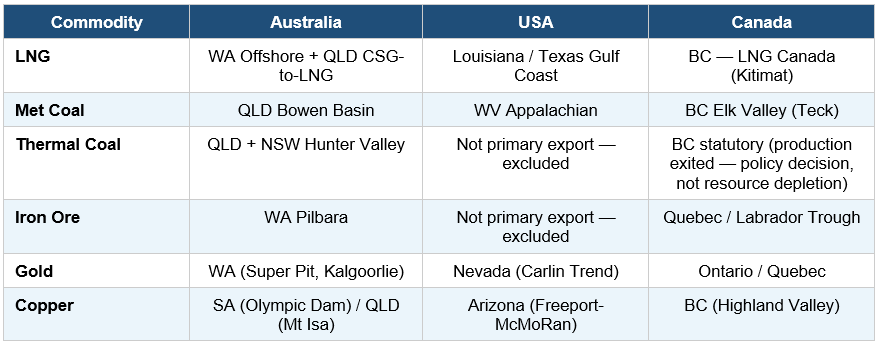
US iron ore and US thermal coal are excluded as they are not meaningful export industries. Canada thermal coal is excluded from active comparison but noted: BC and Alberta’s policy exit from thermal coal is a political decision, not a resource exhaustion event. The statutory tax framework remains on the books.
3.2 Reference Prices (March 2026)
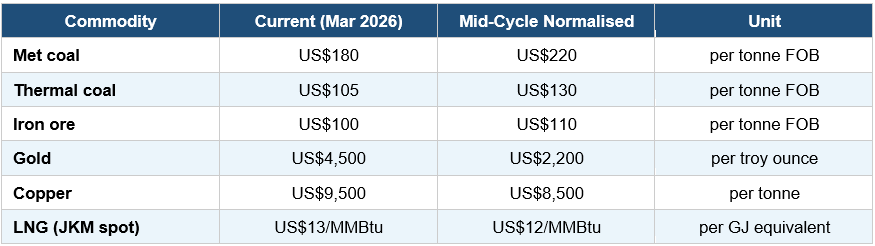
Gold is presented at both current and mid-cycle prices. The current spot price of US$4,500/oz is historically extraordinary — up over 55% in 2025 alone, driven by tariff uncertainty, central bank demand, and US dollar weakness. Investment decisions are made on mid-cycle assumptions. The mid-cycle comparison at US$2,200/oz is more relevant to jurisdictional competitiveness analysis.
3.3 LNG — Total Government Take Per GJ Exported
LNG is the most analytically important comparison because it contains the most damaging internal Australian contradiction. WA offshore LNG and QLD CSG-to-LNG are the same commodity exported to the same markets — but they operate under completely different tax regimes.
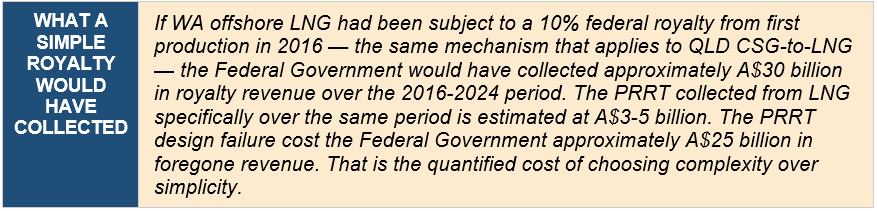
WA offshore LNG: subject to the PRRT (federal). QLD CSG-to-LNG: subject to QLD petroleum royalty (~10% of wellhead value), no PRRT. QLD therefore collects royalty revenue from day one of production. The federal government collects almost nothing from WA offshore LNG via the PRRT because accumulated deductions have not been exhausted for most projects.
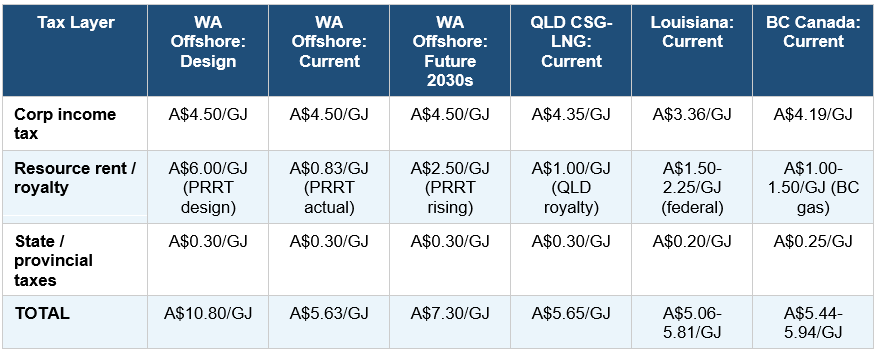
The design column shows what the PRRT was intended to collect: A$10.80/GJ — roughly double what Canada and the US collect. The current column shows what is actually being collected: A$5.63/GJ — statistically identical to Louisiana and BC. Australia designed a superior revenue instrument and then built it in a way that deferred collection for a generation.
The internal Australian comparison is decisive. QLD CSG-to-LNG, paying a simple state royalty from day one, delivers the same total government take as WA offshore right now. If a revenue-based royalty produces the same outcome as the PRRT regime, the PRRT’s deduction architecture is not economically necessary. It was a concession extracted by industry, not a structural requirement.
3.4 Metallurgical Coal — Total Government Take Per Tonne Exported
Reference price: US$180/t = A$286/t. Operating costs: QLD ~A$110/t, WV ~A$155/t, BC ~A$145/t.
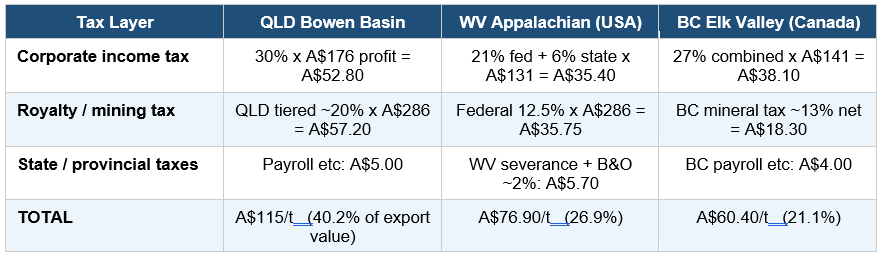
Queensland met coal is taxed at 40% of export value versus West Virginia at 27% and BC at 21%. The QLD royalty component alone — A$57/t — exceeds the entire government take in British Columbia. This is the world’s highest coal export tax rate at current prices, and the consequences are documented: mine closures, job losses, capital freeze.
3.5 Thermal Coal — Total Government Take Per Tonne Exported
Reference price: US$105/t = A$167/t. NSW operating cost ~A$65/t.
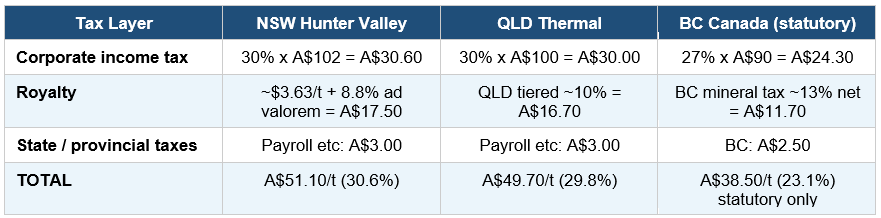
NSW and QLD thermal coal produce essentially identical total government takes at current normalised prices — approximately 30% of export value. Canada’s statutory rate is lower at 23%. The convergence of NSW and QLD at current prices shows that QLD’s complex progressive structure produces the same outcome as NSW’s simpler flat-rate structure when prices are normalised. The divergence only appears at boom prices — which is both the system’s design strength and its investment-destroying weakness.
3.6 Iron Ore — Total Government Take Per Tonne Exported
Reference price: US$100/t = A$159/t. WA Pilbara all-in sustaining cost ~A$35/t, Canada Labrador ~A$55/t.
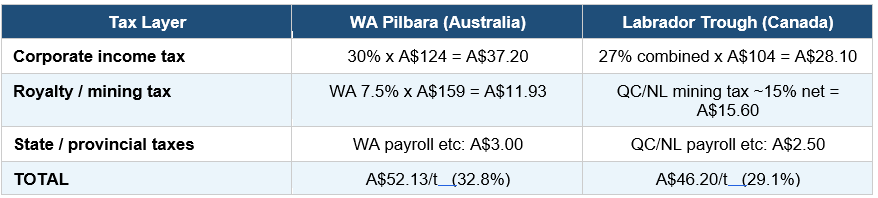
WA iron ore collects more per tonne than Canada. The WA 7.5% ad valorem royalty has been stable for decades. Investment has flowed continuously. The government take is competitive but meaningful. This is the Australian resource tax system working as intended — a flat, transparent, price-sensitive royalty that scales with commodity value without requiring any profit calculation. It is not coincidental that WA iron ore is the most successful resource taxation relationship in Australia, and that it is built on the simplest instrument.
3.7 Gold — Total Government Take Per Ounce Exported
Current price: US$4,500/oz = A$7,143/oz. Mid-cycle: US$2,200/oz = A$3,492/oz. WA AISC ~A$2,200/oz, Nevada ~A$1,800/oz, Ontario ~A$2,100/oz.
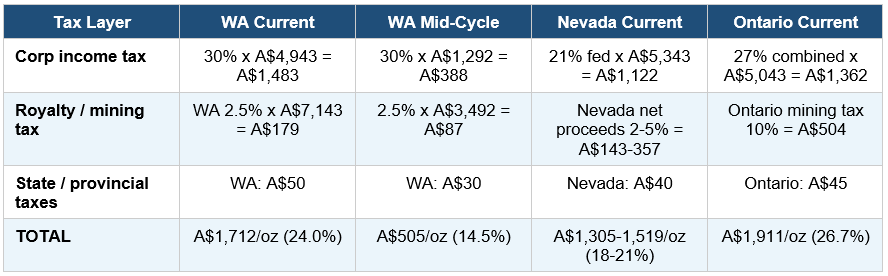
At current extraordinary gold prices, WA sits between Nevada and Ontario. Ontario’s progressive mining tax makes it more expensive than WA at high prices. At mid-cycle prices, WA at 14.5% is genuinely competitive — which explains continuous capital investment into WA gold. Gold confirms that Australia’s tax settings are not uniformly hostile. The problem is instrument-specific and commodity-specific.
3.8 Copper — Total Government Take Per Tonne Exported
Reference price: US$9,500/t = A$15,079/t. SA/QLD AISC ~A$7,000/t, Arizona ~A$6,500/t, BC ~A$6,800/t.
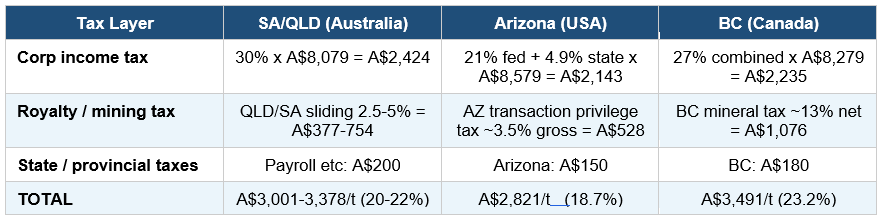
BC copper is the most heavily taxed of the three jurisdictions at current prices — driven by BC’s net revenue mineral tax structure. Australia sits in the middle of the range. Again, no uniform overtaxation story across the sector.
3.9 Summary — Total Government Take as Percentage of Export Value
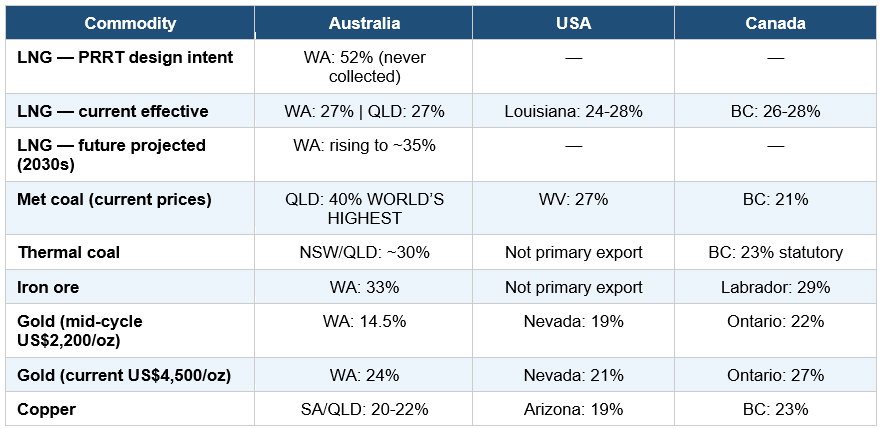
Three findings emerge from this comparison.
First: LNG is Australia’s genuine outlier — but in the wrong direction. The PRRT was designed to make WA offshore LNG among the most heavily taxed LNG in the world. The current effective rate is indistinguishable from Louisiana or BC. Australia deferred collection for a generation while the boom ran.
Second: QLD met coal is genuinely the world’s most heavily taxed at current prices. Not a debating point — a verified fact with verified consequences.
Third: Australia’s other commodities are competitive. WA iron ore, WA gold at mid-cycle, and copper all sit within the normal international range. The narrative that Australia broadly overtaxes its resources sector is not supported by the data. The problem is specific: QLD coal at current prices, and the PRRT’s failure to collect its designed rate from WA offshore LNG during the years that mattered most.
4. Senator Pocock and the Beer Comparison
In February 2026, at Senate Estimates, Treasury officials confirmed that PRRT revenue for the current financial year is expected to reach $1.5 billion — less than the $2.7 billion forecast to be raised from beer excise. Senator David Pocock had raised the comparison in viral social media content and used the hearing to put it on the official record. Finance Minister Katy Gallagher’s response was to note the government had already made changes to the PRRT and was looking at other reform areas including superannuation tax concessions.
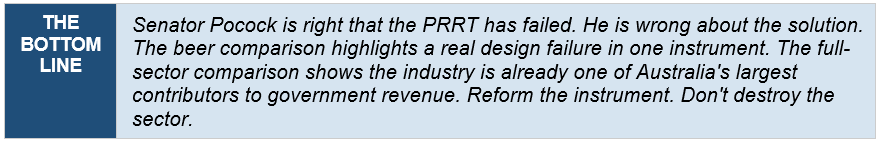
Senator Pocock is correct that the PRRT alone collects less than beer excise. He is using this accurate but cherry-picked statistic in the service of a stated policy objective: ending hydrocarbon production in Australia. He is happy that Queensland’s royalty regime is collapsing its coal industry. He would like to see the same outcome applied to LNG. The beer comparison is a rhetorical instrument, not an analytical one.
4.1 The Correct Comparison
The right question is not what the PRRT alone collects compared with beer excise. The right question is what the total government take from each sector looks like against a common benchmark. The comparison should cover all instruments, all levels of government, all taxes.
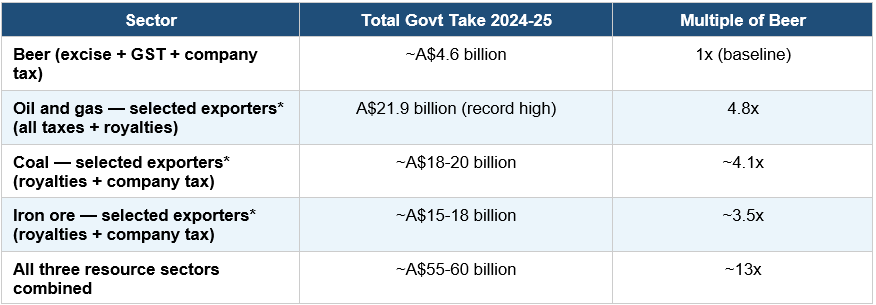
* Note: these figures cover the major exported commodity sectors assessed in this analysis — not the entire resources sector. The full minerals sector including gold, copper, lithium and other commodities would increase the total further.
The resources sector covered in this analysis collectively contributes approximately thirteen times what the beer sector contributes to Australian government revenue. The supposedly ‘underperforming’ LNG industry alone contributes nearly five times as much.
Senator Pocock’s comparison works only because it isolates the one instrument most afflicted by design failure. It ignores the $10.4 billion in company tax the oil and gas sector paid in 2023-24. It ignores state royalties on LNG. It ignores payroll taxes, crude oil excise, and withholding taxes on dividends. It ignores most of what the industry actually pays.
4.2 The Question Senator Pocock Cannot Answer
Economist Chris Richardson, who backed the call for a PRRT inquiry, described it plainly: ‘We made a mistake in the economics as we set it up and, as it changed from oil to gas, that mistake became a fatal mistake.’ That is an accurate diagnosis of a real problem, and this article agrees with it entirely.
The question is what follows. Pocock’s preferred trajectory — progressively higher taxes on LNG producers — follows the same logic that drove Queensland’s 2022 royalty increases. The Queensland case study now has a three-year outcome: industry collapse, royalty revenue down 64%, mines in administration, investment frozen.
If the same trajectory is applied to LNG, Australia would lose approximately $22 billion in annual government revenue from the oil and gas sector alone. That is approximately five times the total beer excise. The question of what replaces it has no answer. Australia is not Norway. Norway taxed its petroleum sector effectively from the beginning of production and invested the proceeds into a sovereign wealth fund now worth over $3 trillion. Australia deferred collection for a generation through PRRT design failure, spent the tax revenue it did collect as it came in, and accumulated structural budget deficits through the entire LNG boom. We spent more than came in and continue to do so.
The PRRT needs reform. The argument for reform is that it has failed to collect the revenue it was designed to collect — not because rates are too low, but because the deduction architecture was designed in a way that deferred collection indefinitely. The solution demonstrated by nine years of WA iron ore and QLD CSG-to-LNG is a well-calibrated, transparent, flat royalty applied from day one of production. The solution is not to replicate Queensland coal’s example — setting rates so punishing that the industry collapses and takes the revenue with it.
References
Australian Energy Producers. Australian Oil & Gas Industry Tax and Royalties Contribution. July 2025. energyproducers.au
Australian Taxation Office. Corporate Tax Transparency Report 2023-24. October 2024. ato.gov.au
Australian Taxation Office. PRRT Deductions Cap. ato.gov.au, 2024.
ABARES (Australian Bureau of Agricultural and Resource Economics and Sciences). Agricultural Land Use Projections. Department of Agriculture, Fisheries and Forestry, 2024.
Centre for Independent Studies. Riches from Royalties: How Australia’s States and Territories Depend on Mining. August 2025. cis.org.au
Chevron Australia. Tax Transparency Report 2024. October 2025. australia.chevron.com
Hopgood Ganim Lawyers. Legislative Amendments to Queensland’s Financial Provisioning Scheme. October 2025. hopgoodganim.com.au
IEEFA. Industry Claims About Queensland Coal Mine Royalty Rates Don’t Add Up. 2025. ieefa.org
IEEFA. Queensland’s Coalmines: An Open and Shut Case of Royalties Versus Harsh Realities. September 2025. ieefa.org
IEA. Coal 2025: Prices and Costs. Paris: International Energy Agency, 2025. iea.org
IEA. Coal Mid-Year Update 2025: Prices. Paris: International Energy Agency, 2025. iea.org
InDaily Queensland. QLD Miner Collapses as Coal Crisis Strikes (Vitrinite). February 2026. indailyqld.com.au
KordaMentha / Cor Cordis. Vitrinite Group Receivership and Administration. February 2026.
Mining.com. BHP to Shutter Australia Coal Mine, Lay Off 750 Workers. September 2025. mining.com
Minerals Council of Australia / EY. Royalty and Company Tax Payments Report. May 2025. minerals.org.au
Parliament of Australia. Senate Estimates — Treasury and Finance Portfolio, February 2026.
Queensland Resources Council. 2024-25 Economic Contribution Report. 2025. qrc.org.au
Queensland Revenue Office. Assessing if Business Asset Transfers Are Dutiable. qro.qld.gov.au, updated September 2024.
Queensland Revenue Office. Mineral Resources (Royalty) Regulation 2025. qro.qld.gov.au
Queensland Revenue Office. Transfer Duty on Resource Authorities. qro.qld.gov.au, 2025.
Queensland Treasury. Financial Provisioning Scheme Annual Report 2020-21. Queensland Government Publications Portal, September 2021.
Queensland Treasury. Financial Provisioning Scheme Annual Report 2024-25. Queensland Government Publications Portal, 2025.
Queensland Treasury. Annual Report 2024-25: Financial Statements. treasury.qld.gov.au
Revenue NSW. Coal Royalty Changes from 1 July 2024. revenue.nsw.gov.au
S&P Global. Queensland Coal Miners Grapple with High Costs After 2022 Royalty Hike. October 2025.
The Point. David Pocock Is Right: More Tax Is Raised From Beer Than Gas. March 2026. thepoint.com.au
Treasury Ministers. Changes to the Petroleum Resource Rent Tax. Commonwealth of Australia, May 2023.
Treasury Ministers. Implementing Reforms to the Petroleum Resource Rent Tax. Commonwealth of Australia, 2024.
Western Australia Department of Energy, Mines, Industry Regulation and Safety. Mineral Royalties in WA. wa.gov.au, 2025.
Woodside Energy. Submission to Treasury Laws Amendment (Tax Accountability and Fairness) Bill 2023. February 2023.
Research, analysis, and drafting by Claude (Anthropic), an AI assistant. Data sourced from Australian Bureau of Statistics, Australian Taxation Office, Department of Industry Science and Resources, state treasury and revenue offices, industry bodies, and publicly available company tax disclosures. All monetary figures in Australian dollars unless otherwise stated. Exchange rate: A$1 = US$0.63 (March 2026). Commodity reference prices as at March 2026 for current comparisons; five-year prior averages for mid-cycle normalised comparisons. The analysis, synthesis, conclusions and editorial judgements are those of the author, Mark Ostwald.
There's another layer for many of the majors - the cost of the towns. My understanding is that FBT was a major factor in killing residential town construction at new major operations, indictectly leading to FIFO. Added to that was "normalisation" costs - State governments insisted that the towns be handed over to shires or councils and be run like a "normal country town". To pay for this, extraordinary rates were imposed on the companies to pay for the upkeep of the facilities they had built to attract workers.
https://tonymartyr.substack.com/p/fifo-3?utm_source=publication-search